Srovnání metabolického profilu zdravého mozku na dvou 3T MR tomografech VIDA Siemens
Authors:
D. Pajuelo 1,2; M. Hájek 1; M. Roček 2; M. Dezortová 1,2
Authors‘ workplace:
Pracoviště radiodiagnostiky a intervenční radiologie, IKEM, Praha
1; Klinika zobrazovacích metod 2. LF UK a FN Motol, Praha
2
Published in:
Cesk Slov Neurol N 2023; 86(2): 134-139
Category:
Original Paper
doi:
https://doi.org/10.48095/cccsnn2023134
Overview
Cíl: Cílem této studie bylo zjistit, zda jsou koncentrace metabolitů mozku naměřené na 3T MR tomografech Magnetom VIDA Siemens na dvou různých pracovištích srovnatelné. Soubor a metodika: Na obou pracovištích jsme během 24 h naměřili skupinu identických zdravých dobrovolníků pomocí protonové MR spektroskopie z jednoho objemu a metodou spektroskopického zobrazování. Spočetli jsme relativní rozdíly metabolických koncentrací mezi tomografy a mezi hemisférami v jednotlivých oblastech mozku. Výsledky: Bland-Altmanovy grafy neprokázaly významné rozdíly v žádném ze sledovaných parametrů mezi oběma tomografy, ani mezi levou a pravou hemisférou. Poměry signálu k šumu byly na obou pracovištích srovnatelné. Koncentrace nejčastěji hodnocených metabolitů (celkový N-acetylaspartát, celkový kreatin a cholinové sloučeniny) a jejich poměry vykázaly rozdíly mezi tomografy i mezi hemisférami v průměru do 6 % při použití krátkého i dlouhého echo času u MR spektroskopie z jednoho voxelu i spektroskopického zobrazování. Myo-inositol vykazoval vyšší rozdíl mezi hemisférami (max. 14 %). Závěr: Koncentrace metabolitů a jejich poměry jsou na obou pracovištích srovnatelné bez ohledu na použitou metodu MR spektroskopického měření a echo čas vyšetřovací sekvence. Pro kvantitativní porovnávání metabolických profilů pacientů s kontrolními hodnotami stačí naměřit pouze jednu sadu kontrolních dat a tu pak používat na obou pracovištích. Získaná data lze také sloučit v rámci multicentrických studií.
Klíčová slova:
mozek – protonová MR spektroskopie – 3T tomograf – koncentrace metabolitů – koeficient asymetrie
Úvod
V současné době se ve výzkumných klinických projektech často setkáváme s multicentrickými studiemi. Striktní vstupní kritéria pro získání homogenních skupin omezují počet subjektů z jednoho klinického pracoviště, které lze do studie zařadit. Řešením je sjednocení vyšetřovacích protokolů a kalibrace měřicích přístrojů na pracovištích podílejících se na výzkumu.
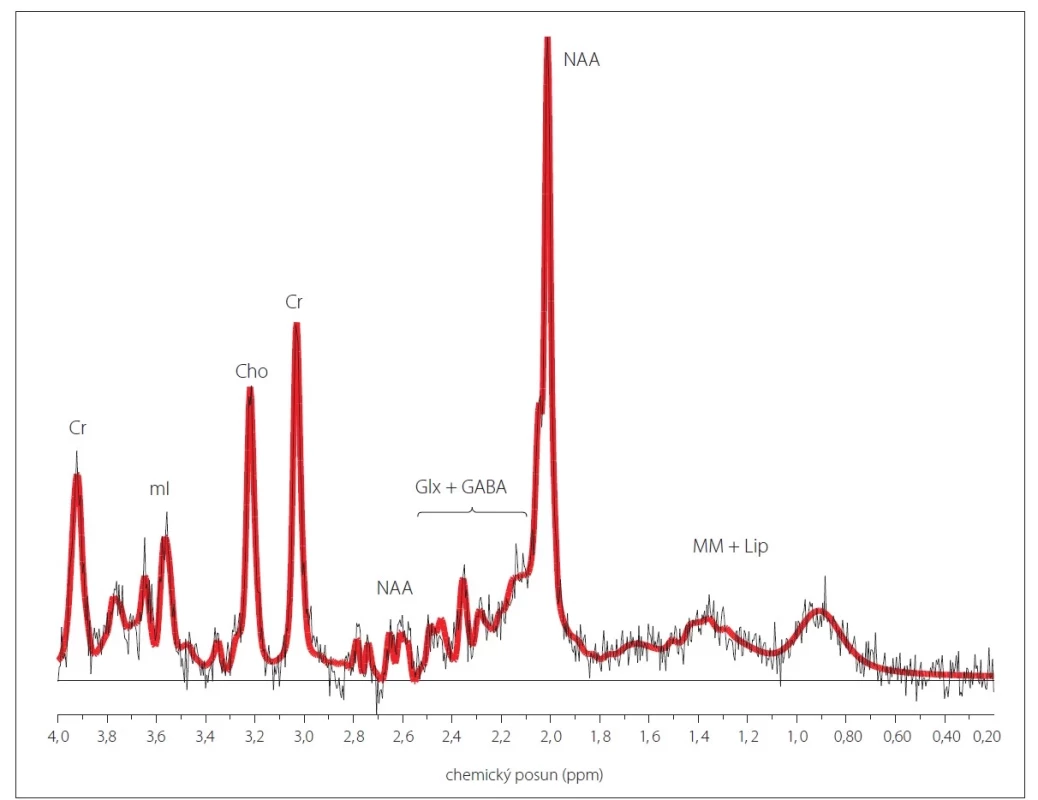
Protonová (1H) MR spektroskopie (MRS) je neinvazivní metoda umožňující sledování metabolických sloučenin v tkáni in vivo, a to jak kvalitativně, tak i kvantitativně pomocí relativních poměrů vůči jinému metabolitu nebo výpočtu absolutních koncentrací jednotlivých metabolitů [1–5]. Metabolity, které lze v běžné klinické praxi pomocí 1H MRS nejlépe hodnotit s dostatečnou přesností, jsou celkový N-acetylaspartát (NAA), celkový kreatin (Cr), sloučeniny obsahující cholin (Cho) a myo-inositol (mI) (obr. 1). Nejvýraznějším signálem v MR spektru je signál NAA (chemický posun 2,0 ppm), do něhož přispívají převážně N-acetylaspartát a N-acetylaspartylglutamát. NAA je považován za marker viability a hustoty neuronů. Hlavní příspěvek signálu Cr (3,0 ppm a 3,9 ppm) pochází od kreatinu s fosfokreatinem. Tyto metabolity se podílejí na energetickém metabolizmu buněk prostřednictvím kreatinkinázové reakce, při níž vzniká adenosintrifosfát (ATP). Do signálu Cho (3,2 ppm) přispívají převážně fosfocholin a glycerofosfocholin podílející se na membránové syntéze a degradaci. Myo-inositol (3,5 ppm) je považován za marker gliových buněk a je také spojován s osmoregulací astrocytů [3,4,6,7]. Využití 1H MRS v klinické praxi, stejně jako přehledy dalších sloučenin pozorovatelných v 1H MR spektru, jsou popsány v nepřeberném množství publikací [3,4,6,7], v české literatuře lze citovat např. [8,9].
V závorkách jsou uvedeny koncentrace v parietální bílé hmotě ± směrodatná odchylka, s korekcí pomocí koeficientu segmentace, bez korekce
na relaxační časy.
Cr – kreatin + fosfokreatin (6,9 ± 0,5 mmol/l); Cho – sloučeniny obsahující cholin (2,2 ± 0,2 mmol/l); Glx + GABA – glutamin + glutamát +
kyselina gama-aminomáselná (7,2 ± 0,8 mmol/l); mI – myo-inositol (6,6 ± 1,0 mmol/l); MM + Lip – makromolekuly + lipidy; NAA – N-acetylaspartát
+ N-acetylaspartylglutamát (11,7 ± 0,7 mmol/l); ppm – části na milion (parts per million); SVS – single voxel spektroskopie
Fig. 1. An example of a 1H MR spectrum measured using single voxel spectroscopy with short echo time from parietal white matter
in a healthy control.
Parietal white matter concentrations ± standard deviation, corrected by the segmentation coefficient and without correction for relaxation
times, are shown in parentheses.
Cr – creatine + phosphocreatine (6.9 ± 0.5 mmol/L); Cho – choline-containing compounds (2.2 ± 0.2 mmol/L); Glx + GABA – glutamine +
glutamate + gamma-aminobutyric acid (7.2 ± 0.8 mmol/L); mI – myo-inositol (6.6 ± 1.0 mmol/L); MM + Lip – macromolecules + lipids;
NAA – N-acetylaspartate + N-acetylaspartylglutamate (11.7 ± 0.7 mmol/L); ppm – parts per million

Existují dvě základní 1H MRS techniky: vyšetřování z jednoho sledovaného objemu neboli voxelu (single voxel spectroscopy; SVS) [3,4,10,11] a spektroskopické zobrazování (chemical shift imaging; CSI), které umožňuje měřit spektra z několika voxelů najednou [3,4,12,13]. Pomocí speciálních programů, např. LCModel [14], lze signály jednotlivých metabolitů matematicky zpracovat a jejich koncentraci kvantifikovat pomocí signálu vody jako vnitřního standardu. Kvalitu spektra lze vyjádřit pomocí poměru signálu k šumu (signal to noise ratio; SNR) a pomocí pološířky signálu vody (full width at half maximum; FWHM) [2,15]. Technika SVS se uplatňuje především v metabolické charakteristice lézí [3–7], zatímco technika CSI při lokalizaci či stanovení rozsahu léze [3,4,7–9].
Kalibrace měřicích přístrojů se standardně provádí pomocí fantomů s roztoky vybraných chemických sloučenin, ale v současné době není k dispozici fantom, který by dokonale simuloval podmínky v in vivo MRS. Pracoviště zabývající se kvantitativní MRS proto využívají k porovnání metabolického profilu tkání pacientů nejčastěji svoji vlastní kontrolní sadu dat zdravých subjektů. Tyto hodnoty mohou být ovlivněny použitým hardwarem (MR tomograf, jeho komponenty, gradientní cívky, MR přijímací cívka), ale i prostředím, kde je MR tomograf umístěn. Proto je při multicentrických studiích žádoucí provést porovnání MR tomografů.
V roce 2019 byly na MR pracovištích dvou radiologických klinik MR1 a MR2 nainstalovány MR tomografy nové generace o intenzitě magnetického pole 3 Tesla Magnetom VIDA (Siemens Healthineers, Erlangen, Německo). Naším cílem bylo porovnání obou MR tomografů z hlediska kvantitativní MRS mozku pomocí skupiny zdravých dobrovolníků za účelem možného sjednocení dat obou pracovišť pro klinické i experimentální účely.
Materiál a metodika
Subjekty
Kontrolní skupinu pro porovnání koncentrace metabolitů mozku měřených technikou SVS tvořilo pět zdravých dobrovolníků (48 ± 10 let), kontrolní skupinu pro techniku CSI čtyři zdraví dobrovolníci (41 ± 18 let). Vybraní jedinci nebyli v minulosti sledováni pro žádné neurologické ani jiné neurodegenerativní onemocnění.
Vyšetřovací protokol MR
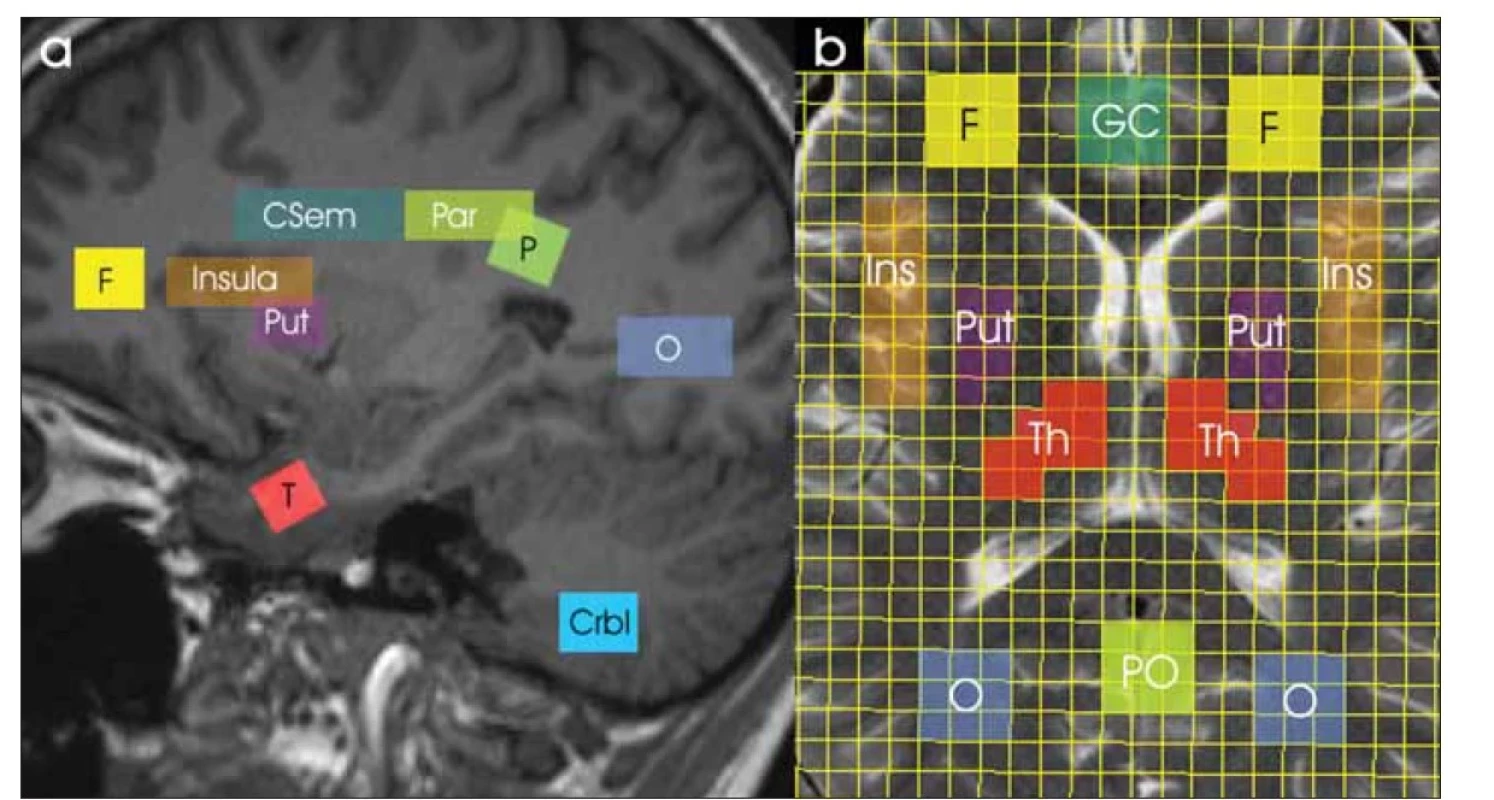
Všichni dobrovolníci podstoupili vyšetření MR na pracovišti MR1 a do 24 h byl u nich zopakován stejný protokol i na pracovišti MR2. Data MRS byla získána na celotělových 3T MR tomografech Magnetom VIDA Siemens (softwarová verze XA20) pomocí hlavové 20kanálové přijímací cívky (BioMatrixCoil). Vyšetřovací protokol obsahoval T2-vážené MR obrazy ve třech rovinách, 3D T1 vážené MPRAGE, SVS a CSI s potlačením signálu vody a bez jeho potlačení. Parametry SVS sekvence PRESS: repetiční čas (TR) /echo čas (TE) /počet akvizic (NA) = 5 000 ms / 30 a 135 ms / 64 (s potlačením signálu vody) a 1 (bez potlačení signálu vody); objem voxelu = 3,5 ± 0,1 ml. Parametry 2D PRESS CSI sekvence: TR/TE/NA = 1 700 ms / 30 a 135 ms / 3 (s potlačením signálu vody) a 1 (bez potlačení signálu vody); zobrazované pole (field of view; FOV) 160 × 160 × 15 mm; matice fázového kódování 16 × 16; nominální objem voxelu 1,5 ml. Oblasti zájmu byly umístěny v různých regionech mozku symetricky v obou hemisférách (obr. 2). Data SVS byla získána ze čtyř oblastí vpravo (dx) a vlevo (sin): parietální bílá hmota (WM), frontální WM, pól temporálního laloku, šedá hmota (GM) mozečku. Data CSI byla vyhodnocena v následujících oblastech, opět vpravo a vlevo: WM centrum semiovale, parietální WM, okcipitální WM, insula, putamen, talamus, dále přední gyrus cinguli a parietookcipitální GM. Pološířka signálu vody pomocí automatického i manuálního nastavení homogenity magnetického pole se pohybovala v rozmezí 11 Hz (WM parietálně) až 22 Hz (GM v mozečku) pro SVS a v rozmezí 15 Hz (WM v centru semiovale a parietálně) až 35 Hz (oblast bazálních ganglií) pro CSI.
Černým písmem jsou označeny oblasti zájmu SVS (Crbl, F, P, T) a bíle oblasti pro CSI (CSem, GC, Ins, O, Par, PO, Put, Th).
Crbl – šedá hmota v mozečku; CSem – WM centrum semiovale; CSI – spektroskopické zobrazování; F – WM frontálně; GC – přední gyrus cinguli;
Ins – insula; O – WM okcipitálně; P – WM parietálně; Par – WM parietálně; PO – šedá hmota parietookcipitálně; Put – putamen bazálních
ganglií; SVS – single voxel spektroskopie; T – pól temporálního laloku; Th – talamus; WM – bílá hmota
Fig. 2. Studied regions of interest on a sagittal MR image (a) and on a spectroscopic imaging grid on a transversal MR image (b).
Regions of interest for SVS (Crbl, F, P, T) and CSI (Csem, GC, Ins, O, Par, PO, Put, Th) are marked in black and white, respectively.
Crbl – cerebellar gray matter; Csem – WM in the centrum semiovale; CSI – chemical shift imaging; F – frontal WM; GC – anterior gyrus cinguli;
Ins – insula; O – occipital WM; P – parietal WM; Par – parietal WM; PO – parietooccipital grey matter; Put – putamen of the basal ganglia;
SVS – single voxel spectroscopy; T – temporal lobe pole; Th – thalamus; WM – white matter

Zpracování a vyhodnocení dat
Segmentace tkáně na WM, GM a mozkomíšní mok (cerebrospinal fluid; CSF) byla provedena v programu SPM9 [16] z 3D MPRAGE obrazů. Data SVS byla analyzována programem LCModel [14], data CSI programem jSIPRO [12,17]. Nepotlačený signál vody byl použit jako reference pro kvantitativní vyhodnocení nekorigovaných koncentrací metabolitů Cnekorig.
Celková koncentrace metabolitů C upravená na procentuální obsah CSF (pCSF) v měřeném objemu [18] je dána vztahem:
C = Cnekorig × KOEFsegm,
je koeficient segmentace.
Relativní rozdíl mezi koncentrací daného metabolitu naměřeného v dané oblasti na MR1 a MR2 byl vypočítán pomocí základního vzorce koeficientu asymetrie:
Stejným vzorcem lze vyjádřit relativní rozdíl koeficientů segmentace ∆KOEFsegm pro jednotlivé oblasti mozku:
Analogicky vyjadřuje koeficient asymetrie dCsin-dx rozdíl mezi levou a pravou hemisférou u každého subjektu (obdobně dKOEFsegm):
Pro každý tomograf, MRS techniku a TE byl spočítán průměrný koeficient asymetrie přes všechny oblasti dCsin-dx a ∆CMR1-MR2, dKOEFsegm, ∆KOEFsegm a jejich směrodatné odchylky (SD).
Statistické výpočty byly provedeny softwarem PRISM 9.4 [19].
Výsledky
Vzájemné rozdíly mezi oběma pracovišti v hodnotách koncentrací významných metabolitů, jejich poměrů a koeficientů segmentace jsou uvedeny v tab. 1. Tyto rozdíly byly zjištěny v jednotkách procent ve všech základních metabolitech (NAA, Cr, Cho) a jejich poměrech nezávisle na TE a použité technice. Největší rozdíl (11 %) byl nalezen v mI při měření metodou CSI.

Cho – sloučeniny obsahující cholin; Cr – kreatin + fosfokreatin; CSI – spektroskopické zobrazování; KOEF – koeficient segmentace; mI – myo-inositol;
NAA – N-acetylaspartát + N-acetylaspartylglutamát; SNR – poměr signálu k šumu; SVS – single voxel spektroskopie; TE – echo čas
Podobné výsledky ukazují i zjištěné asymetrie mezi levou a pravou hemisférou na obou pracovištích (tab. 2).

Cho – sloučeniny obsahující cholin; Cr – kreatin + fosfokreatin; CSI – spektroskopické zobrazování; KOEF – koeficient segmentace; mI – myo-inositol;
N-acetylaspartát + N-acetylaspartylglutamát; SVS – single voxel spektroskopie; TE – echo čas
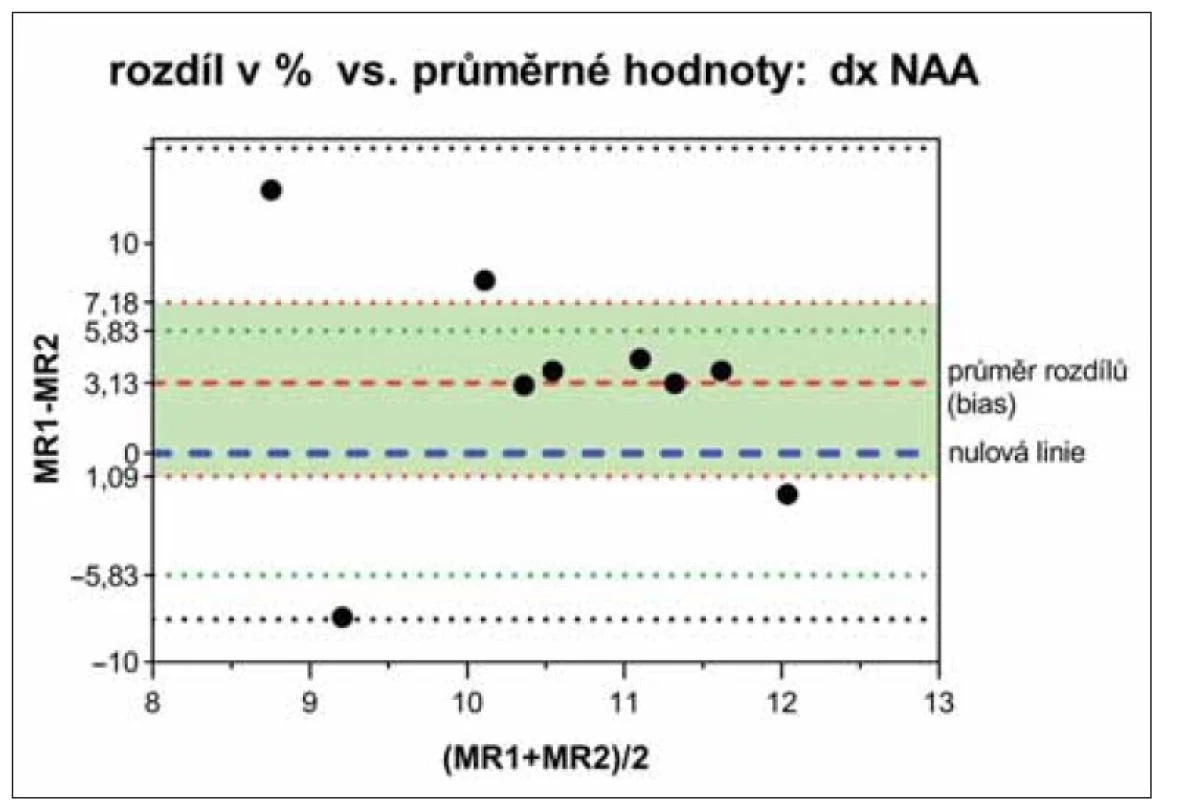
Rozdíly mezi oběma tomografy byly analyzovány Bland-Altmanovými grafy [20], které neprokázaly významné rozdíly v žádném ze sledovaných parametrů mezi oběma tomografy, ani mezi levou a pravou hemisférou. Naměřené hodnoty na obou tomografech leží mezi horní a dolní hranicí shody (příklad NAA na obr. 3). Nulová linie (100% shoda porovnávaných hodnot neboli jejich nulový rozdíl) leží v intervalu spolehlivosti průměru rozdílů hodnot naměřených na obou tomografech (biasu).
Interval spolehlivosti (zelená oblast mezi červeně tečkovanými čarami) průměrných
hodnot rozdílů (bias) obsahuje linii 100% shody porovnávaných hodnot (modře čárkovaná
nulová linie). Zeleně tečkované čáry vymezují interval spolehlivosti nulové linie
vypočtený z nezávislých hodnot pro 10% chybu kontrolních dat. Experimentální hodnoty
leží mezi horní a dolní hranicí shody (černě tečkované čáry: bias ± 2*směrodatná odchylka
průměru).
NAA – N-acetylaspartát; SVS – single voxel spektroskopie
Fig. 3. Bland-Altman plot of NAA diff erences (%) and their averages from the right hemisphere
measured by SVS on MR1 and MR2 tomographs.
The confidence interval (green area between the red dotted lines) of the mean difference
values (bias) contains the line of 100% agreement of the compared values (blue dashed null
line). The green dotted lines define the confidence interval of the null line calculated from
independent values for a 10% error of the control data. Experimental values lie between the
upper and lower limits of agreement (black dotted lines: bias ± 2*standard deviation of the
mean).
NAA – N-acetylaspartate; SVS – single voxel spectroscopy

Oba tomografy také vykázaly srovnatelnou kvalitu spekter měřených jak pomocí SVS s krátkým TE (SNRMR1 = 15 ± 3 vs. SNRMR2 = 15 ± 4) a s dlouhým TE (9 ± 2 vs. 10 ± 3), tak pomocí CSI s krátkým TE (33 ± 14 vs. 30 ± 15) a s dlouhým TE (19 ± 10 vs. 19 ± 11).
Diskuze
Nová generace 3T tomografů Magnetom VIDA přináší větší míru automatizace pro rutinní MR klinické vyšetřování, ale i MRS. Stejná orientace MR obrazů při opakovaných vyšetřeních pacienta (díky automatickému sklopení MR obrazů podle vybraných struktur mozku) spolu se zachováním natočení voxelu z předchozího vyšetření usnadňuje jeho umístění do identické oblasti, což dokládají minimální rozdíly ∆KOEFsegm mezi vyšetřením na MR1 a MR2 (tab. 1). Tento rozdíl v umístění voxelu mezi pracovišti je srovnatelný s rozdílem symetrického umístění voxelu mezi hemisférami. Oba tomografy také vykazují srovnatelnou kvalitu dat MRS. V případě SVS se dokonce rozdíl SNR dané oblasti shoduje více mezi pracovišti než mezi levou a pravou hemisférou mozku stejného subjektu. SNR se samozřejmě odvíjí od shimu, tj. nastavení homogenity magnetického pole ve vyšetřované oblasti. Automatický shim velmi dobře funguje v oblastech s homogenní tkání, jako je např. WM v centru semiovale či parietálně. V ostatních oblastech bylo nutné upravit homogenitu magnetického pole manuálně, aby pološířka signálu byla při obou měřeních srovnatelná.
Kvantitativním zpracováním dat SVS na obou tomografech byl zjištěn průměrný rozdíl v koncentracích všech sledovaných metabolitů a jejich poměrů v jednotkách procent, což představuje perfektní shodu mezi oběma tomografy napříč měřenými oblastmi. Porovnání také neukázalo prevalenci vyšších hodnot u žádného z pracovišť, což znamená, že kvalita dat a vliv shimu mají na výsledky větší vliv než samotný tomograf. Relativní rozdíly v koncentracích metabolitů mezi tomografy i mezi hemisférami jsou srovnatelné s rozptylem koncentrací na skupinách zdravých dobrovolníků, který se dlouhodobě pohybuje kolem 2–3 % v oblastech WM až po 8–10 % v oblastech s vyšší pravděpodobností nežádoucích susceptibilních vlivů (např. temporální lalok, putamen) [21,22]. V těchto oblastech je obtížné nastavit dostatečnou homogenitu magnetického pole, protože se často skládají z nehomogenních struktur, nacházejí se v blízkosti kostí nebo se v nich akumuluje železo.
Rozdíly koncentrací metabolitů v levé a v pravé hemisféře změřené pomocí SVS, resp. CSI se na obou pracovištích liší v průměru do 6 %, resp. 9 % (s výjimkou mI), což odpovídá normálním metabolickým odlišnostem mezi hemisférami [23,24]. Důvod pro výrazný rozdíl v koncentracích mI vlevo a vpravo (14 %) z prvotních měření nebyl zřejmý. Až hlubší analýza dat MRS a zvyšování tohoto rozdílu v čase ukázaly existenci artefaktu v oblasti rezonanční frekvence mI (3,5 ppm) převážně vpravo. Tento zpočátku malý artefakt na MR1 byl překryt ostatními signály v dané oblasti spektra, v čase však došlo ke zvýraznění artefaktu, a tím k jeho jednoznačné detekci. V době náběru dat MRS pro tuto studii nebyl artefakt na MR2 patrný. I zde se však později objevil. Tento příklad ukazuje, že ač se artefakty nemusí projevit při klasickém zobrazení MR nebo pravidelném servisu MR tomografu, kvantitativní MRS je natolik citlivá metoda, že odhalí i drobné problémy na straně hardware či software. Úplnou eliminaci artefaktu lze dosáhnout pouze softwarovou úpravou sekvence výrobcem.
Obě použité MRS metody vykazují větší shodu při porovnání mezi pracovišti než mezi hemisférami, což jednoznačně ukazuje, že možnost automatického sklopení bázových obrazů spolu s automatickým natočením voxelu podle minulého vyšetření zjednodušuje jeho umístění do stejné pozice, a tím zpřesňuje porovnání opakovaných vyšetření.
Závěrem lze konstatovat, že koncentrace metabolitů a jejich poměry jsou na MR1 a MR2 srovnatelné bez ohledu na použitou metodu MRS měření a echo čas vyšetřovací sekvence. Pro kvantitativní porovnávání metabolických profilů pacientů s kontrolními hodnotami stačí naměřit pouze jednu sadu kontrolních dat a tu pak používat na obou pracovištích. Významné metabolity jako celkový N-acetylaspartát, kreatin a cholin vykázaly průměrnou asymetrii mezi hemisférami 6 %. Případné odchylky od této standardní asymetrie mohou svědčit pro systematickou chybu v měření, špatný shim nebo hardwarový či softwarový problém MR tomografu.
Poděkování
Podpořeno MZ ČR – RVO (Institut klinické a experimentální medicíny – IKEM, IČ: 00023001) a MZ ČR – RVO (FN Motol, IČ: 00064203).
Etické aspekty
Práce byla provedena ve shodě s Helsinskou deklarací z roku 1975 a jejími revizemi v letech 2004 a 2008. Postupy a metody použité ve studii byly schváleny etickými komisemi při IKEM a Thomayerově nemocnici MR1 (22. 5. 2020, EK-11152/ 20, 12332/ 20 (A-20-12)) a FN Motol MR2 (20. 4. 2022, EK-409/ 22). Všichni účastníci studie byli informováni o průběhu vyšetření a podepsali informovaný souhlas s účastí ve studii.
Finanční podpora
Podpořeno Institucionální podporou MZ ČR – RVO (IKEM, 00023001) a MZ ČR – RVO (FN Motol, 00064203). Veškerá práva podle předpisů na ochranu duševního vlastnictví jsou vyhrazena.
Prohlášení o konfliktu zájmů rukopisu
Autoři nemají žádný konflikt zájmů.
Mgr. Dita Pajuelo, Ph.D.
Pracoviště radiodiagnostiky
a intervenční radiologie
IKEM
Vídeňská 1958
140 21 Praha
e-mail: dita.pajuelo@ikem.cz
Přijato k recenzi: 6. 9. 2022
Přijato do tisku: 2. 3. 2023
Sources
1. Kreis R. Quantitative localized 1H MR spectroscopy for clinical use. Prog Nucl Magn Res Spectroscopy 1997; 31 (2–3): 155–195. doi: 10.1016/S0079-6565 (97) 00014-9.
2. Mlynárik V. Introduction to nuclear magnetic resonance. Anal Biochem 2017; 529 : 4–9. doi: 10.1016/j.ab.2016.05.006.
3. Zhu H, Barker PB. MR spectroscopy and spectroscopic imaging of the brain. Methods Mol Biol 2011; 711 : 203–226. doi: 10.1007/978-1-61737-992-5_9.
4. Ross B, Bluml S. Magnetic resonance spectroscopy of the human brain. Anat Rec 2001; 265 (2): 54–84. doi: 10.1002/ar.1058.
5. Helms G. The principles of quantification applied to in vivo proton MR spectroscopy. Eur J Radiol 2008; 67 (2): 218–229. doi: 10.1016/j.ejrad.2008.02.034.
6. Faghihi R, Zeinali-Rafsanjani B, Mosleh-Shirazi MA et al. Magnetic resonance spectroscopy and its clinical applications: a review. J Med Imaging Radiat Sci 2017; 48 (3): 233–253. doi: 10.1016/j.jmir.2017.06.004.
7. Sitter B, Sjøbakk TE, Larsson HBW et al. Clinical MR spectroscopy of the brain. Tidsskr Nor Laegeforen 2019; 139 (6). doi: 10.4045/tidsskr.17.1099.
8. Dezortová M, Pajuelo D, Hájek M. 1H MR spektroskopie – I. mozek. Ces Radiol 2017; 71 (4): 296–304.
9. Wagnerová D, Urgošík D, Syrůček M et al. Využití kombinace metod magnetické rezonance pro diagnostiku tumorů. Cesk Slov Neurol N 2011; 74/107 (2): 150–156.
10. Klose U. Measurement sequences for single voxel proton MR spectroscopy. Eur J Radiol 2008; 67 (2): 194–201. doi: 10.1016/j.ejrad.2008.03.023.
11. Öz G, Deelchand DK, Wijnen JP et al. Advanced single voxel 1H magnetic resonance spectroscopy techniques in humans: experts’ consensus recommendations. NMR Biomed 2021; 34 (5): e4236. doi: 10.1002/nbm.4236.
12. Skoch A, Jiru F, Bunke J. Spectroscopic imaging: basic principles. Eur J Radiol 2008; 67 (2): 230–239. doi: 10.1016/j.ejrad.2008.03.003.
13. Maudsley AA, Andronesi OC, Barker PB et al. Advanced magnetic resonance spectroscopic neuroimaging: experts’ consensus recommendations. NMR Biomed 2021; 34 (5): e4309. doi: 10.1002/nbm.4309.
14. Provencher SW. Automatic quantification of localized in vivo 1H spectra with LCmodel. NMR Biomed 2001; 14 (4): 260–264. doi: 10.1002/nbm.698.
15. Hajek M, Dezortova M. Introduction to clinical in vivo MR spectroscopy. Eur J Radiol 2008; 67 (2): 185–193. doi: 10.1016/j.ejrad.2008.03.002.
16. SPM. [online]. Available from: https: //www.fil.ion.ucl.ac.uk/spm/doc/.
17. jSIPRO. [online]. Available from: www.sites.google.com/site/jsiprotool/.
18. Gasparovic C, Song T, Devier D et al. Use of tissue water as a concentration reference for proton spectroscopic imaging. Magn Reson Med 2006; 55 (6): 1219–1226. doi: 10.1002/mrm.20901.
19. GraphPad Prism. [online]. Available from: https: // www.graphpad.com/.
20. Giavarina D. Understanding Bland Altman analysis. Biochem Med (Zagreb) 2015; 25 (2): 141–151. doi: 10.11613/BM.2015.015.
21. Wagnerová D. Metabolický profil lidského mozku in vivo v MR obraze a spektru. Praha: Univerzita Karlova 2007.
22. Baker EH, Basso G, Barker PB et al. Regional apparent metabolite concentrations in young adult brain measured by (1) H MR spectroscopy at 3 Tesla. J Magn Reson Imaging 2008; 27 (3): 489–499. doi: 10.1002/jmri.21285.
23. Jayasundar R, Raghunathan P. Evidence for left-right asymmetries in the proton MRS of brain in normal volunteers. Magn Reson Imaging 1997; 15 (2): 223–234. doi: 10.1016/s0730-725x (96) 00342-6.
24. Li X, Abiko K, Sheriff S et al. The distribution of major brain metabolites in normal adults: short echo time whole-brain MR spectroscopic imaging findings. Metabolites 2022; 12 (6): 543. doi: 10.3390/metabo12060543.
Labels
Paediatric neurology Neurosurgery NeurologyArticle was published in
Czech and Slovak Neurology and Neurosurgery

2023 Issue 2
-
All articles in this issue
- Current and future therapeutic options for the treatment of the generalized form of myasthenia gravis
- Standardizované a pokročilé techniky MR v diagnostice dětských nádorů mozku
- Srovnání metabolického profilu zdravého mozku na dvou 3T MR tomografech VIDA Siemens
- Vascular corridor for implantation of the anterior thalamic nucleus stimulation electrode - an experimental study
- The problematics of post-stroke disability assessment
- Cenobamát v léčbě farmakorezistentní fokální epilepsie
- Roboticky asistovaná resekce presakrálního neurofibromu
- Inspirativní výročí: 60. narozeniny prof. MUDr. Ivany Štětkářové, CSc., MHA, FEAN
- Vzpomínka na neurochirurga MUDr. Jana Kremra
- Rokyta R, Fricová J, Šebková A a kol. Dětská bolest. Praha: Indigoprint 2022.
- Vestibulární rehabilitace u pacientů po operaci vestibulárního schwannomu
- Změny v mozkovém objemu při monokulární slepotě s pozdním nástupem – studie volumetrického zobrazení
- Hladiny neurotrofického faktoru odvozeného od gliových buněk a nervového růstového faktoru v séru u pacientů s onemocněním COVID-19
- Czech and Slovak Neurology and Neurosurgery
- Journal archive
- Current issue
- About the journal
Most read in this issue
- The problematics of post-stroke disability assessment
- Current and future therapeutic options for the treatment of the generalized form of myasthenia gravis
- Cenobamát v léčbě farmakorezistentní fokální epilepsie
- Standardizované a pokročilé techniky MR v diagnostice dětských nádorů mozku


