How extracellular sodium replacement affects the conduction velocity distribution of rats’ peripheral nerves
Jak náhrada extracelulárního sodíku ovlivňuje distribuci rychlosti vedení periferním nervem u krysy
V elektrofyziologických studiích je substituce sodíku používaná jako metoda v extracelulárním prostředí. N-methyl-D-glukamin (megulamin, NMG) je pomocnou látkou díky své farmakologicky neaktivní povaze, která umožňuje blokovat proud Na+ na buněčné úrovni. V této studii jsme zkoumali změny týkající se vlivu skupin vláken na složený akční potenciál (compound action potential; CAP) během náhrady NMG. Náhrada vedla k významnému poklesu jak amplitudy, tak plochy CAP u každé nahrazené skupiny. Úplná náhrada nezmenšila plochu CAP v porovnání s částečnou náhradou. Bylo prokázáno, že různé poměry nahrazení Na+ v extracelulárním médiu s NMG způsobují změny v aktivitách některých nervových vláken, stejně jako blokádu vedení. Závěry jsou získané specifickou metodou výpočtu distribuce rychlosti nervového vedení. Částečná náhrada extracelulárního Na ovlivňuje rychle vodivé skupiny vláken, zatímco úplná náhrada ovlivňuje pomalu vodivé skupiny vláken.
Autoři deklarují, že v souvislosti s předmětem studie nemají žádné komerční zájmy.
Redakční rada potvrzuje, že rukopis práce splnil ICMJE kritéria pro publikace zasílané do biomedicínských časopisů.
Klíčová slova:
složený akční potenciál – distribuce rychlosti nervového vedení – N-methyl-D-glukamin – periferní nerv
Authors:
S. Tuncer 1; M. C. Celen 2
Authors‘ workplace:
Faculty of Medicine, Osmangazi University, Eskişehir, Turkey
1; Meram Faculty of Medicine, Necmettin Erbakan University, Konya, Turkey
2
Published in:
Cesk Slov Neurol N 2019; 82(2): 209-214
Category:
Original Paper
doi:
https://doi.org/10.14735/amcsnn2019209
Overview
In electrophysiological studies, the substitution of Na+ is used as a method in the extracellular environment. N-methyl-D-glucamine (megulamine; NMG) is an excipient because of its pharmacologically inactive nature, which can block the Na currents at a cellular level. In this study, we investigated alterations in the contributions of fi ber groups to compound action potential (CAP) during NMG replacement. The replacement resulted in a significant decrease in both the amplitude and the area of the CAP for each replacement group. Full replacement did not decrease the CAP area compared to partial replacement. Different replacement ratios of Na+ in the extracellular medium with NMG have been shown to cause changes in the activities of some nerve fibers, as well as blocking the conduction. The findings were obtained by the specific distribution of the nerve conduction velocity calculation method. The partial replacement of extracellular Na affects the fast-conducting fiber groups, whereas full replacement affects the slow-conducting fiber groups.
细胞外钠置换对大鼠周围神经传导速度分布的影响
在电生理学研究中,Na+的取代被用作细胞外环境的一种方法。N-methyl-D-glucamine (megulamine;NMG)是一种赋形剂,因为它的药理活性,可以阻断细胞水平的钠电流。在本研究中,我们研究了NMG置换过程中纤维基团对复合动作电位(CAP)贡献的变化。置换后,每个置换组的帽幅和帽面积均显著减小。与部分置换相比,完全置换并没有减少帽面积。在细胞外培养基中,不同比例的Na+与NMG的置换会引起某些神经纤维活动的改变,并阻断神经传导。通过对神经传导速度计算方法的具体分布情况进行分析,得出结论。细胞外Na的部分替代影响快速传导纤维组,而完全替代影响慢传导纤维组。
关键词:
复合动作电位-神经传导速度分布 - n -甲基 - d -氨基葡萄糖-周围神经
Keywords:
compound action potential – nerve conduction velocity distribution – N-metyl-D-glucamine – peripheral nerve
Introduction
N-methyl-D-glucamine (megulamine; NMG) is an agent used mostly as a benign excipient or vehicle of a drug in pharmacology to improve drug absorption. It also offers the potential for improved muscle function and reduction in metabolic syndrome and diabetes mellitus complications by systemic administration with no observable adverse effects [1]. However, in electrophysiological in vitro applications, when used as a component of a replacement medium, it mimics the presence of an Na+ compound and blocks Na+ currents in the cell membrane [2,3]. The peripheral nerves play an important role in conducting processed information to target motor units for generating elaborate movement patterns. Considering the importance of the speed of this information transfer, changes in nerve conduction velocity (CVD) become important. Nerve CVD measurement can be performed by dividing the distance between the recording and stimulating electrodes by the time for the nerve compound action potential (CAP) to travel that distance, which is called latency [4]. With this measurement, only the velocity information of the fastest-conducting fibers can be gathered, rather than that of the slower fiber groups that constitute most of the nerve bundle. Any change in the cellular level affects these fiber groups differently [5]. The most accurate method of measuring these changes is to calculate the nerve CVD [6–8]. With this study, we aimed to investigate the alterations in the CVD histogram of rats’ sciatic nerves by changing the extracellular Na concentration with an NMG replacement.
Material and methods
This study was approved by the Ethics Committee of Necmettin Erbakan University Experimental Medicine Application and Research Center Konya, Turkey (Approval No. 2017-023). Due to gender-dependent differences in the rats’ sciatic nerve fiber CVD, only male Sprague-Dawley rats weighing 200–250 g (10–12 weeks old) were used for this study. The experiments were realized in the Meram Medical Faculty Biophysics research laboratory. During the experiments, eight animals were used, and all these animals were cared for in accordance with the National Institute of Health Guide for the care and use of laboratory animals. All chemicals which were used for the experiments were purchased from Sigma (Sigma-Aldrich Chemie, Steinheim, Germany).
The rats were killed by decapitation using a specially prepared laboratory guillotine without anesthesia. Immediately, the sciatic nerves were dissected from the hind limbs of the rats, then transferred into an organ bath, which was perfused with modified Krebs solution (119 mM NaCl, 4.8 mM KCl, 1.8 mM CaCl2, 1.2 mM MgSO4, 1.2 mM KH2PO4, 20 mM NaHCO3, and 10 mM glucose, having a pH of 7.4 and gassed with a mixture of 95% O2 and 5% CO2) at a constant rate of 5 mL/ min at a fixed temperature (37 ± 0.5 °C). Only the sciatic nerves from one side of the animals were used for the experiments.
The experiments were performed under three different mediums; control (exposed to Krebs Solution), pNMG (exposed to 40 mM NaCl, 127 mM NMG, 4.8 mM KCl, 1.8 mM CaCl2, 1.2 mM MgSO4, 1.2 mM KH2PO4, 20 mM NaHCO3, and 10 mM glucose, having a pH of 7.4 and gassed with a mixture of 95% O2 and 5% CO2) and fNMG (exposed to 135 mM NMG, 4.8 mM KCl, 1.8 mM CaCl2, 1.2 mM MgSO4, 1.2 mM KH2PO4, 20 mM NaHCO3, and 10 mM glucose, having a pH of 7.4 and gassed with a mixture of 95% O2 and 5% CO2). In both replacement media, there is also Na+ ion from bicarbonate buffer which is assumed not to affect the current blockage of NMG. For the exposure experiments, the recording chamber media was changed for modified Krebs solutions. In the control group, none of the replacement chemicals were added to the recording chamber. The sciatic nerves were exposed to partial replacement and full replacement of Na+ with NMG for 30 min which is the time required for the maximum decrease in CAP amplitude, according to data from our preliminary experiments. The recording was performed at the 30th minute of the exposure.
Square–shaped supramaximal pulses of 0.2 ms duration at a frequency of 1 Hz were given for the stimulations from the proximal ends of the nerve trunk via a stimulus isolation unit (Model SIU5 [Grass Instruments Co., West Warwick, RI, USA]) using a stimulator (Model Grass S88K [Grass Instruments Co., West Warwick, RI, USA]). In order to guarantee the recording from the same activated number of fibers at any point along the nerve, CAP recordings were performed from the tibial branch of the isolated nerve trunk using a suction electrode fixed on an organ bath. Supramaximal pulses were determined as the stimuli of intensity of approximately 20% higher voltage than that required for gaining maximum CAP amplitude. The amplified and filtered (1 Hz to 10 KHz) (CP511 AC Amplifier [Grass Instruments Co., West Warwick, RI, USA]) CAP signals were digitized by an A/ D converter card (Model PCL 1710 [Advantech Co., Taiwan]) at 40 KSPS (kilosamples s–1) using the open-source CAP recording software Real-time Compound Action Potential (RETICAP [ICON Research Lab, Konya, Turkey]) produced in our laboratory and stored on a hard disk for further analysis [9]. Signal averaging was not necessary due to pure CAP signals.
In this study, two different conduction velocity (CV) calculations were obtained. For this purpose, two time differences (∆tcap and ∆tpeak) were measured; ∆tcap is the time delay between the moment the stimulus is delivered and the onset of the CAP, and ∆tpeak is the time delay between the moment the stimulus is delivered and the moment when the CAP amplitude reaches its maximum value. When ∆x is determined as the distance between the stimulating and recording electrodes:
CVcap = ∆x/ ∆tlcap (1)
CVpeak = ∆x/ ∆tpeak (2)
Conduction velocities for each experimental group were estimated using eqs. (1) and (2), where ∆x was taken as 30 mm.
The maximum depolarizations (MD, mV), time derivatives (dV/ dt, mV/ ms) of the CAPs, and the areas under the CAPs (mV × ms) were also calculated. The maximum time derivatives, which correspond to the maximum rate of change in the rising phase of the CAPs, can also be used as an index of the conduction activity of the nerve fibers in a bundle. The area under the CAP is proportional to the number of excited nerve fibers, so the areas under the CAPs were calculated.
To obtain information about the individual activities of nerve fiber groups having different CVs, CVD histograms were developed using a mathematical model that was enhanced using the model proposed by Cummins et al [6,7]. The basic principle of the model based on the statements of the CAP can be expressed as:
N
CAP(t) = Σ wifi(t – τi)
i = 1
where the CAP(t): the observed CAP as a function of time, N is the number of fiber classes, wi is the amplitude weighting coefficients for class i, and fi(t) is the single-fiber action potential in class i. The weighting coefficients (wi) are general parameters to account for all influences on the contribution of each fiber class to the observed CAP. To estimate the individual activities of the nerve fiber groups from the CAPs, the CVDs for all nerves of the Start, pNMG, and fNMG groups were calculated. The CVD histogram is divided into three subgroups: slow, medium, and fast, for the reason that the visual interpretation can be done easily during Na+ replacement with NMG.
Unless otherwise specified, the comparisons between the groups were done using a one-way analysis of variance (ANOVA), followed by the Duncan post hoc test for multiple comparisons when the analysis of variance indicated significant results. P < 0.05 was considered significant. The data are presented as mean ± standard error mean (SEM).
Results
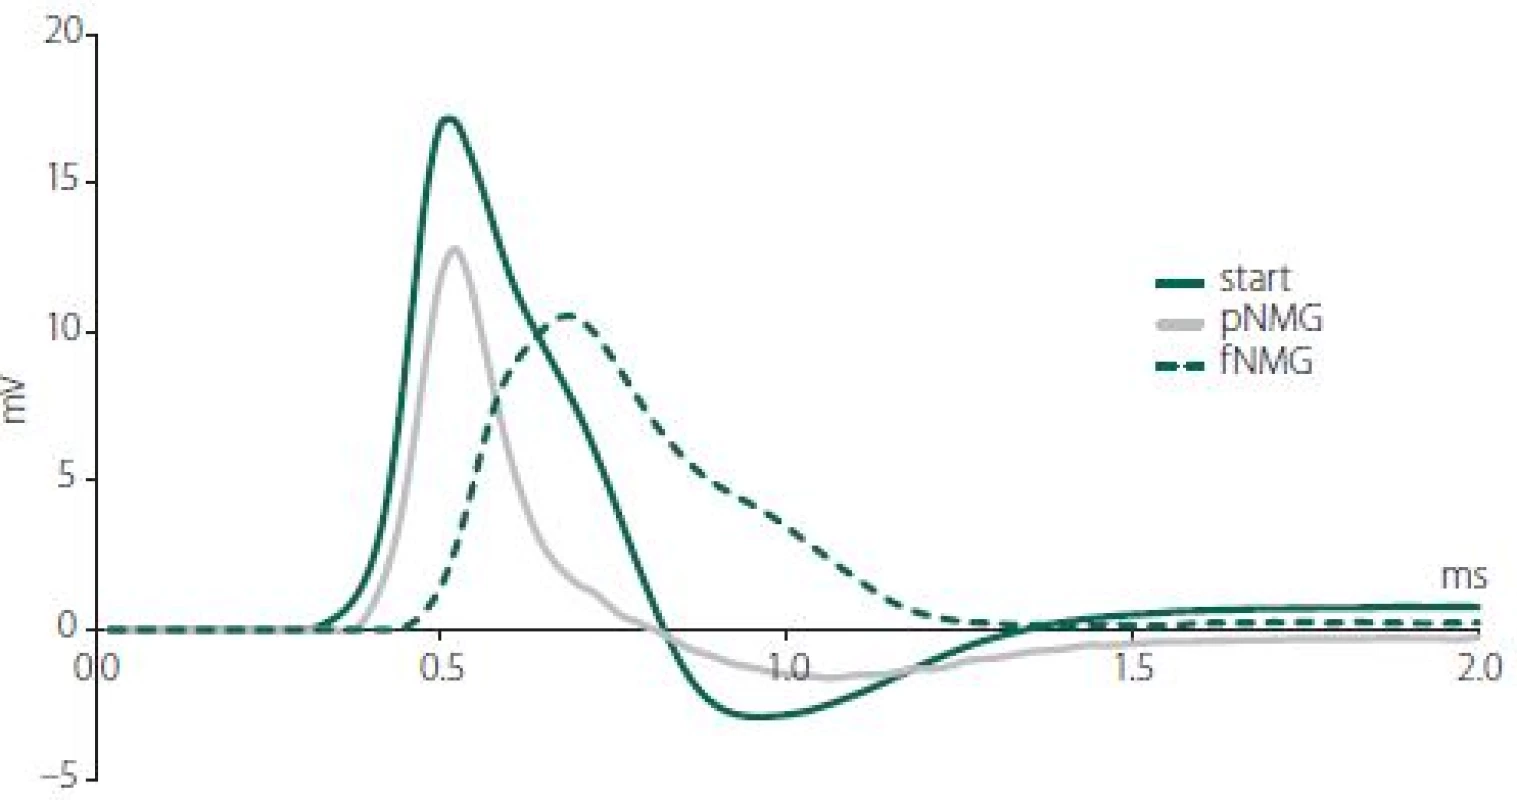
The replacement of Na+ with NMG in the extracellular medium depressed the CAP dramatically in both partial (pNMG) and full (fNMG) replacement. Sample CAP traces are given in Fig. 1 for each replacement medium in the same time axis. The MD value for each replacement group is found to be significantly decreased (Fig. 2A). For the full replacement group, the MD parameter was also found to be significantly decreased when compared to partial replacement (P < 0.05). Partial NMG replacement caused a 28.00 ± 4.60% change while full replacement caused a 42.74 ± 4.92% change as against the start. Both replacements resulted in a significant decrease in area (mV × ms) of the CAP (Fig. 2B). However, the decrement in area was not significant when compared to partial replacement (P < 0.05). Partial NMG replacement caused a 22.99 ± 6.84% change while full replacement caused a 27.73 ± 4.02% change as against the start. The maximum time derivative (max. dV/ dt, mV/ ms) and the minimum time derivative (min. dV/ dt, mV/ ms) values of the CAPs are significantly decreased for both replacement groups (Fig. 2C). Full replacement also caused significant decreases for each time derivative parameter when compared to partial replacement (P < 0.05).
Obr. 1. Křivky akčního potenciálu vzorové sloučeniny zachycené z jednoho nervového svazku v každé skupině (start, pNMG, fNMG) ve vzdálenosti 30 mm od stimulačních elektrod. fNMG – plné nahrazení N-methyl-D-glukaminu; NMG – N-methyl-D-glukamin; pNMG – částečné nahrazení N-methyl-D-glukaminu
Obr. 2. (A) Maximální depolarizace CAP; (B) vypočítaná plocha pod křivkou CAP; (C) hodnoty jsou uvedeny jako střední hodnota ± SEM (start, pNMG, fNMG; n = 8).
* – p < 0,05 v porovnání se skupinou start; # – p < 0,05 v porovnání se skupinou pNMG CAP – akční potenciál sloučeniny; fNMG – plné nahrazení N-methyl-D-glukaminu; n – počet; NMG – N-methyl-D-glukamin; pNMG – částečné nahrazení N-methyl-D-glukaminu; SEM – střední chyba průměru

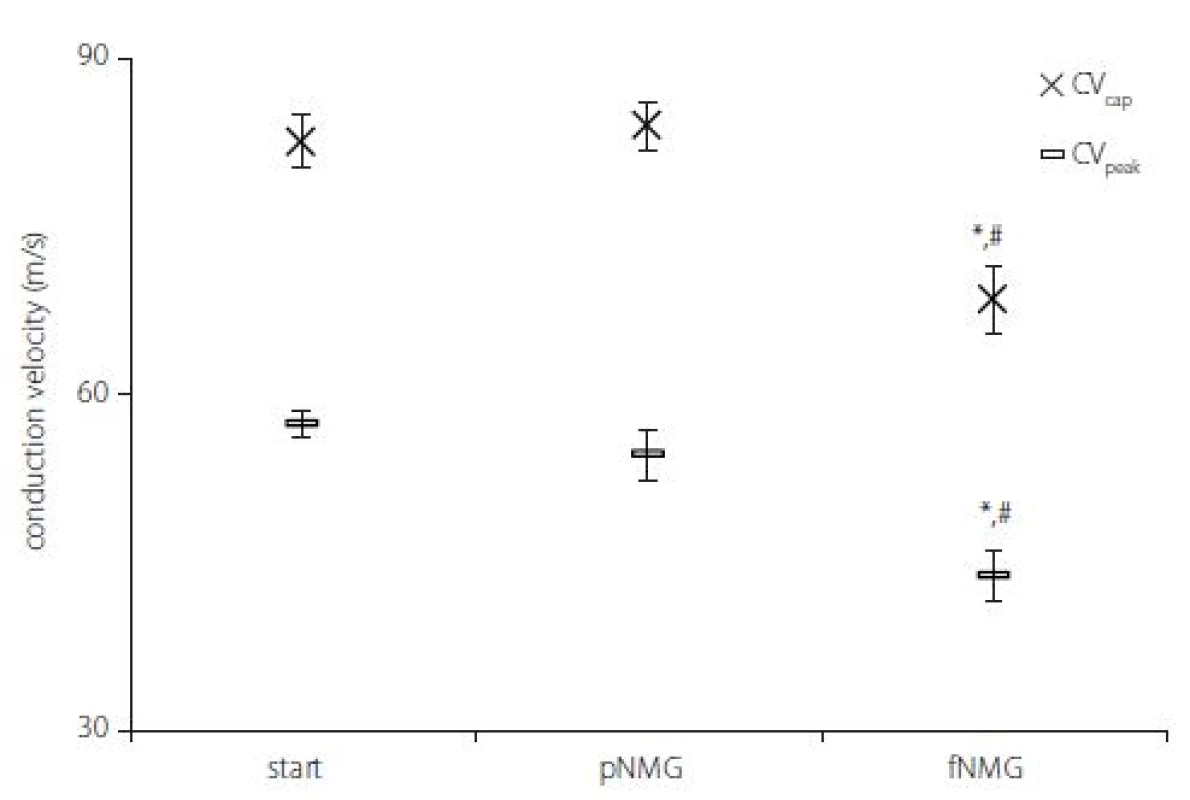
As explained in the Materials and methods section, two CVs were calculated by using two different latency measurements; CVcap and CVpeak. While partial replacement did not show any effect, full replacement showed a significant decrease for both CVs (Fig. 3) (P < 0.05). The decrement was 16.92 ± 2.03% for CVcap and 23.62 ± 3.46% for CVpeak as against the start.
Obr. 3. Rychlosti vedení vzruchu v jednotlivých experimentálních skupinách. Hodnoty jsou uvedeny jako střední hodnota ± SEM (Start, pNMG, fNMG; n = 8).
* – p < 0,05 v porovnání se skupinou Start; # – p < 0,05 v porovnání se skupinou pNMG CV – rychlost vedení vzruchu; fNMG – plné nahrazení N-methyl-D-glukaminu; n – počet; NMG – N-methyl-D-glukamin; pNMG – částečné nahrazení N-methyl-D-glukaminu; SEM – střední chyba průměru
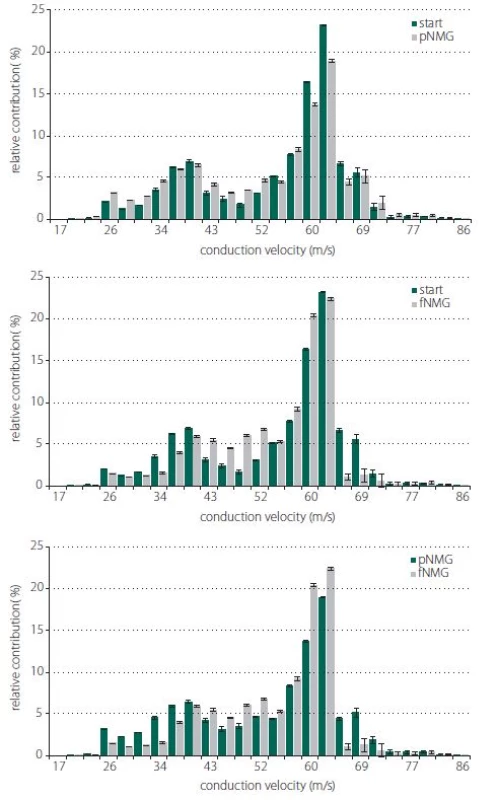
Estimated CVD histograms were given in Fig. 4, which were calculated by using an inverse mathematical model. In these histograms, the percent relative contribution was shown for 25 bins, which corresponds to CVs ranging from 17 to 86 m/ s. Despite the fact that these relatively higher resolution distributions show a general tendency for each replacement group, for the purpose of getting a better assessment, three main CV subgroups were described. The ranges for CV subgroups are 17–33 m/ s for slow, 34–59 m/ s for medium, and 60–86 m/ s for fast.
Obr. 4. Odhadované histogramy CVD a relativní příspěvek skupin CVD. Porovnání histogramů relativního příspěvku nervových vláken s různými rychlostmi vedení vzruchu; (A) start/pNMG; (B) start/fNMG; (C) pNMG/fNMG. Procentuální příspěvky jsou uvedeny jako střední hodnota ± SEM (start, pNMG, fNMG; n = 8). CVD – distribuce rychlosti vedení vzruchu; fNMG – plné nahrazení N-methyl-D-glukaminu; n – počet; pNMG – částečné nahrazení N-methyl-D-glukaminu; SEM – střední chyba průměru
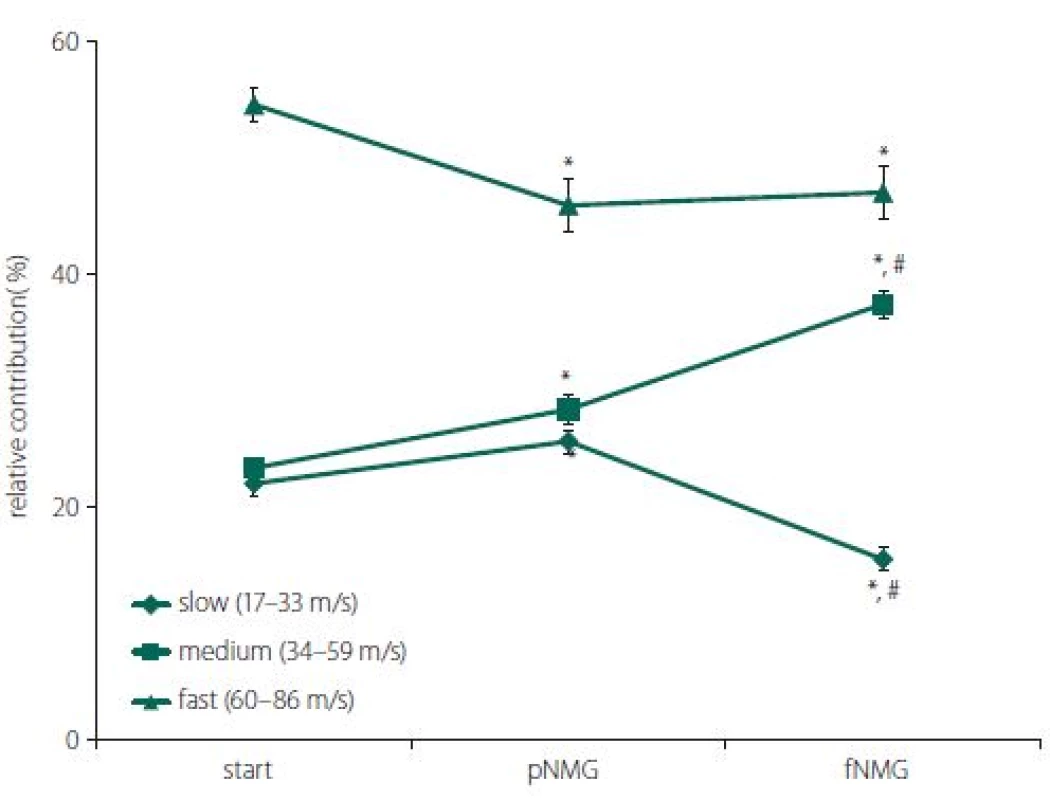
A significant change was found for all CV subgroups after each replacement. Partial replacement resulted in a significant depression on the fast-conducting fiber group, while the contributions of the medium - and slow-conducting fiber groups were found to be increased. Full replacement did not cause any change in the contribution of the fast--conducting subgroup, but the contribution of the slow-conducting subgroup was significantly decreased (Fig. 5).
Obr. 5. Procentuální relativní příspěvek skupin rychlosti vedení vzruchu; pomalá, střední a rychlá pro každou skupinu náhrady extracelulárního media (start, pNMG, fNMG; n = 8). Hodnoty jsou uvedeny jako střední hodnota ± SEM. fNMG – plné nahrazení N-methyl-D-glukaminu; n – počet; pNMG – částečné nahrazení N-methyl-D-glukaminu; SEM – střední chyba průměru
Discussion
In this study, we replaced extracellular Na+ with NMG in different ratios to decrease the Na+ current. However, the replacement of Na+ with Li or NMG in the extracellular medium is a well-studied subject in many studies conducted on single neurons [10–12]. In order to understand changes in ionic currents such as Ca+2 modulation after the replacement of extracellular Na+, studying with isolated neurons is the only option. Nevertheless, when the peripheral nervous system is the subject, it is not possible to study on axons of single neurons. Many known neuropathies affect mainly peripheral nerve conduction [13]. Because peripheral nerves are formed by the packaging of more than one axon in a sheath, their conduction properties may be different from what they show alone. The CV-related structural differences between the axons as another variable also make this difference greater. With our study, we investigated changes in the contribution of nerve fibers having different CVs and the general parameters of CAP after partial and full replacement of extracellular Na+ with NMG.
The results of our study indicate that both partial and full replacement of extracellular Na+ with NMG inhibited nerve conduction. Especially in full replacement, the latency and shape of the CAP were affected dramatically (Fig. 1). The measured MD values of the CAP were significantly reduced with both replacement media, and that can be attributed to an alteration in single fiber action potential (SFAP) CV. This finding, due to the nature of the CAP, can be interpreted as the complete blockade of the activity of some single nerve fibers. Since the area under the CAP is directly related to the number of contributing nerve fibers, the area (mV × ms) was calculated in order to investigate the presence of any blockades. While both partial and full replacement cause a significant decrease when compared with the start, it is interesting to note that full replacement does not cause any difference when compared to partial replacement (Fig. 2A). The interpretation of these two parameters together is important in the following respect: If the CVD changes without blockage, the MD can be changed without any change in the area of CAP [14]. Therefore, this situation, which can be interpreted as an indicator of a change only in distribution, were seen for full replacement (Fig. 2B). The rising phase of the CAPs is shaped by the fastest-conducting fibers, while the falling phase is shaped by the rest of the fibers [15]. The upstroke velocity, which is the maximum value of the time derivative of the CAP, decreased significantly with the increasing level of the replacement medium. The minimum value of the time derivative, which reflects the rapidity of the falling phase, is also decreased significantly by the increased level of the replacement medium (Fig. 2C). A dramatic decrease in both parameters shows that the contribution of nerve fibers having different conduction properties has changed [8]. Even if the rising phase was affected in the partial replacement group, it was revealed that the fastest fibers were primarily affected. In order to better understand this finding, two different CVs were calculated; CVcap and CVpeak, which is obtained by using two different latency measurements. As seen in Fig. 3, partial replacement did not show any difference for both CVs, while full replacement caused a significant decrease. The percentage of this decrement in CVpeak was higher than in CVcap, which means full replacement affects most of the fiber groups (except the fastest fibers) rather than just the fibers having the fastest CV. These CV calculation methods are traditional and used mostly in clinical studies to assess the changes in nerve conduction of the fastest or the medium CV groups [16]. However, assessment of the relative number of active fibers for discrete CV values in a nerve bundle can be possible using CVD calculations. Determination CVD is a numeric method that requires forward and backward calculation using SFAP models [6,7].
With this unique method that is enhanced by our study group, CVD histograms are obtained and the changes in the contributions of fibers having different CVs before and after a certain event can be observed [8,17]. In our study, the question is how the replacement of Na+ with NMG affects the contributions of fibers having different CVs; in other words, fibers having different axon diameters and myelin thicknesses, since these structural properties are known to be factors affecting the CV of a nerve fiber. Histograms for CVDs are given in Fig. 4 for each replacement group in 25 bins ranging from 17 m/ s to 86 m/ s. For the pNMG group, the most notable change in relative contribution seemed to be on the right side of distribution, which corresponds to the fastest-conducting fiber groups (Fig. 4A). These types of fibers also seemed to be affected by full replacement, but in this instance, a prominent change was seen in the middle of the distribution (Fig. 4B). When a comparison of the replacement groups is desired, this time, a shift towards the middle of the distribution from the left side draws attention, while there is no change on the right side of the distribution (Fig. 4C). The best way to consider any contribution shift between the nerve fibers that means CV changes or any conduction blockage is to divide the CVD histograms into subgroups as defined in the Results section. When changes in the percent relative contribution of predefined CV subgroups were considered, partial replacement affected each CV subgroup significantly (Fig. 5). A decrement in fast (60–86 m/ s) fibers seems to be compensated with increments in other subgroups. However, for the pNMG group, we know that a significant decrease in both CAP area and MD value means that there is blockage in some nerve fibers (Fig. 2A and 2B). Thus, the decrease in the contribution of fast fibers also involves blockage. When the fNMG group is in question, this time there is no change in the contribution of fast fibers, while a significant increase appears in the contribution of medium (34–59 m/ s) fibers, which appears to compensate for the decrease in the contribution of slow (17–33 m/ s) fibers (Fig. 5). We also have the knowledge that there are no blockages in this group because of the fact that there is no change in the area under the CAP (Fig. 2A and 2B).
Morphometric and histological studies in literature have shown that fibers having slow CV or small axon diameters are more susceptible to pathological conditions such as diabetic neuropathy [18]. According to studies testing the CVD change after drug-induced neurotoxicity, axons having large diameters are more resistant to neurotoxic conditions [19]. However, in contrast with these studies, in our study nerve fiber groups having a fast CV in a peripheral nerve bundle are shown to be affected first from the replacement of an essential ion. It would be more appropriate to interpret the findings of our study based on the nerve conduction studies of pharmacological agents with Na+ channel blockade effects. Fast fibers having a larger axon diameter correspond to the sensory nerves, and it is a known fact that local anesthetics tended to block the conduction of larger fibers first by blocking voltage-gated Na channels [20]. Motor (small myelinated) fibers are found to be affected first by bupivacaine, which is a local anesthetic agent [21]. On the other hand, in our previous study, tramadol application showed that fast-conducting fibers were more susceptible to conduction blocks than others [20]. Although the mechanisms of action of local anesthetics are different, our study showed in detail the changes in activities of axons having a different CV by blocking only Na+ currents by replacing Na+ outside the cell with NMG.
The authors declare they have no potential conflicts of interest concerning drugs, products, or services used in the study.
The Editorial Board declares that the manuscript met the ICMJE “uniform requirements” for biomedical papers.
The authors of this article would especially like to thank Prof. Nizamettin Dalkilic for his scientifically valuable comments and Prof. Selim Kutlu for technical support in their experiments.
The authors declare they have no potential conflicts of interest concerning drugs, products, or services used in the study.
The Editorial Board declares that the manuscript met the ICMJE “uniform requirements” for biomedical papers.
Accepted for review: 17. 8. 2018
Accepted for print: 13. 2. 2019
Murat C. Celen, MSc
Necmettin Erbakan University
Meram Faculty of Medicine
Department of Biophysics
42060 Konya
Turkey
e-mail: muratcenkcelen@gmail.com
Sources
1. Bravo-Nuevo A, Marcy A, Huang M et al. Meglumine exerts protective eff ects against features of metabolic syndrome and type II diabetes. PLoS One 2014; 9(2): e90031. doi: 10.1371/ journal.pone.0090031.
2. Spindler AJ, Noble SJ, Noble D et al. The eff ects of sodium substitution on currents determining the resting potential in guinea-pig ventricular cells. Exp Physiol 1998; 83(2): 121–136.
3. Buckler KJ, Vaughan-Jones RD. Eff ects of hypercapnia on membrane potential and intracellular calcium in rat carotid body type I cells. J Physiol 1994; 478(Pt 1): 157–171.
4. Delisa JA, Lee HJ, Baran EM. Manual of nerve conduction velocity and clinical neurophysiology. 3rd ed. New York: Raven Press 1994.
5. Krarup C. Compound sensory action potential in normal and pathological human nerves. Muscle Nerve 2004; 29(4): 465–483.
6. Cummins KL, Perkel DH, Dorfman LJ. Nerve fi ber conduction - velocity distributions. I. Estimation based on the single-fi ber and compound action potentials. Electroencephalogr Clin Neurophysiol 1979; 46(6): 634–646.
7. Cummins KL, Dorfman LJ, Perkel DH. Nerve fi ber conduction - velocity distributions. II. Estimation based on two compound action potentials. Electroencephalogr Clin Neurophysiol 1979; 46(6): 647–658.
8. Tuncer S, Dalkilic N, Esen HH et al. An early dia gnostic tool for diabetic neuropathy: conduction velocity distribution. Muscle Nerve 2011; 43(2): 237–244. doi: 10.1002/ mus.21837.
9. ICON Reserch Lab. RETICAP. Available from URL: http:/ / icon.unrlabs.org/ projects/ reticap/ .
10. Liu X, Stan Leung L. Sodium-activated potassium conductance participates in the depolarizing after potential following a single action potential in rat hippocampal CA1 pyramidal cells. Brain Res 2004; 1023(2): 185–192.
11. Vikhareva EA, Zamoyski VL, Grigoriev VV. Modifi cation of calcium-activated chloride currents in cerebellar purkinje neurons. Bull Exp Biol Med 2017; 162(6): 709–713. doi: 10.1007/ s10517-017-3694-1.
12. Kennedy HJ, Thomas RC. Intracellular calcium and its sodium-independent regulation in voltage-clamped snail neurones. J Physiol 1995; 484(Pt 3): 533–548.
13. Gasparotti R, Padua L, Briani C et al. New technologies for the assessment of neuropathies. Nat Rev Neurol 2017; 13(4): 203–216. doi: 10.1038/ nrneurol.2017.31.
14. Taylor PK. CMAP dispersion, amplitude decay, and area decay in a normal population. Muscle Nerve 1993; 16(11): 1181–1187. doi: 10.1002/ mus.880161107.
15. Dalkiliç N, Pehlivan F. Derivatives and integrals of compound action potential of isolated frog sciatic nerves. J Ankara Med School 1994; 16 : 634–646.
16. Ayaz M, Dalkilic N, Tuncer S et al. Selenium-induced changes on rat sciatic nerve fi bers: compound action potentials. Methods Find Exp Clin Pharmacol 2008; 30(4): 271–275. doi: 10.1358/ mf.2008.30.4.1166220.
17. Dalkiliç N, Pehlivan F. Comparison of fi ber diameter distributions deduced by modeling compound action potentials recorded by extracellular and suction techniques. Int J Neurosci 2002; 112(8): 913–930.
18. Jakobsen J. Axonal dwindling in early experimental diabetes. I. A study of cross sectioned nerves. Diabetologia 1976; 12(6): 539–546.
19. Cavaletti G, Marmiroli P. Chemotherapy-induced peripheral neurotoxicity. Expert Opin Drug Saf 2004; 3(6): 535–546.
20. Dalkilic N, Tuncer S, Bariskaner H et al. Eff ect of tramadol on the rat sciatic nerve conduction: a numerical analysis and conduction velocity distribution study. Yakugaku Zasshi 2009; 129(4): 485–493.
21. Dalkilic N, Bariskaner H, Dogan N et al. The eff ect of bupivacaine on compound action potential parameters of sciatic nerve fi bers. Int J Neurosci 2004; 114(1): 1–16. doi: 10.1080/ 00207450490257159.
Labels
Paediatric neurology Neurosurgery NeurologyArticle was published in
Czech and Slovak Neurology and Neurosurgery

2019 Issue 2
-
All articles in this issue
- Intradural extramedullary spinal cord tumors
- Multiple sclerosis and the role of gut microbiota during a harmful inflammatory response
- Genetic and neurobiological aspects of comorbid occurence of autism spectrum disorder and epilepsy
- Extra-intracranial bypass indicated during neurorehabilitation due to cognitive deterioration
- Traumatic pseudoaneurysm of the superficial temporal artery
- Multiple sclerosis, pregnancy, maternity, and breastfeeding
- Multiple sclerosis and pregnancy from a gynecologist‘s perspective – as sisted reproduction options
- Modern microsurgery as a permanent, safe and gentle solution of unruptured intracranial aneurysms
- Surgical explantation of a vagal nerve stimulator according to the magnetic resonance imaging protocol
- General movements and neurological development of the early age in children with neonatal hypoglycemia
- Comparison of cosmetic effects after short longitudinal and transverse skin incision for carotid endarterectomy
- Rapid diagnostics of chemokine CXCL13 in the cerebrospinal fluid of patients with neuroborreliosis
- Genetics of neuromuscular diseases
- Analýza dat v neurologii LXXIV. - Neparametrický Spearmanův koeficient korelace
- Recenze knih
- Doc. Vladimír Škorpil, 100 let od narození zakladatele naší elektromyografie
- Does leptin have a role in the development of intracranial meningiomas?
- A comparative study of myasthenic patients in the Czech and Slovak Republics
- Changes in essential and trace elements content in degenerating human intervertebral discs do not correspond to patients’ clinical status
- How extracellular sodium replacement affects the conduction velocity distribution of rats’ peripheral nerves
- Aneurysmal subarachnoid haemorrhage in pregnancy – successful clipping after coiling failure
- Tick-borne meningitis complicated by a cardioembolic intraluminal carotid artery thrombus and stroke
- Czech and Slovak Neurology and Neurosurgery
- Journal archive
- Current issue
- About the journal
Most read in this issue
- Intradural extramedullary spinal cord tumors
- Rapid diagnostics of chemokine CXCL13 in the cerebrospinal fluid of patients with neuroborreliosis
- Genetics of neuromuscular diseases
- Multiple sclerosis and pregnancy from a gynecologist‘s perspective – as sisted reproduction options
